Visualizing Graphs
Visual Graphs from University of Florida:
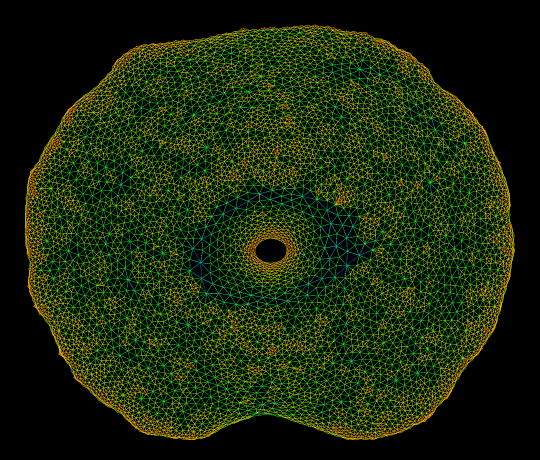
"Graph visualization is a way to discover and visualize structures in complex relations. What sort of structures are people who do large scale computation studying? We can get a glimpse by visualizing the thousands of sparse matrices submitted to the University of Florida Sparse Matrix collection using sfdp algorithm . The resulting gallery contains the drawing of graphs as represented by 2541 sparse matrices in this collection. Each of these sparse matrices (a rectangular matrix is treated as a bipartite graph) is viewed as the adjacency matrix of an undirected graph, and is laid out by a multilevel graph drawing algorithm. If the graph is disconnected, then the largest connected component is drawn. The largest graphs have tens of millions of nodes and over a billion of edges. A simple coloring scheme is used: longer edges are colored with colder colors, and short ones warmer.
 uh...WOW....that's uh...yeeah...wow....this totally made me realize that I really don't care about whatever is written in that paragraph!! That's totally amazing!
How about let's just stare at these for awhile and forget about trying to analyzing whatever matrices and matrixesses in existance....I'm totally into that.


